Beyond medicines, plastics and climate control, are there other ways fossil fuels impact healthcare? Yes, and the biggest one is transportation. The healthcare industry depends on oil and natural gas to move patients in ambulances, deliver supplies to their facilities, and get their staff to work. Even the staff that are riding the subway in large metropolitan areas are using electricity produced with natural gas. If you have a specific question, send us a message or plan to join us at the Eastern Gas Compression Roundtable, May 3-5, 2022 at the David Lawrence Convention Center in downtown Pittsburgh, PA.
CH4 Facts
CH4 Facts: CO Levels Trending Down
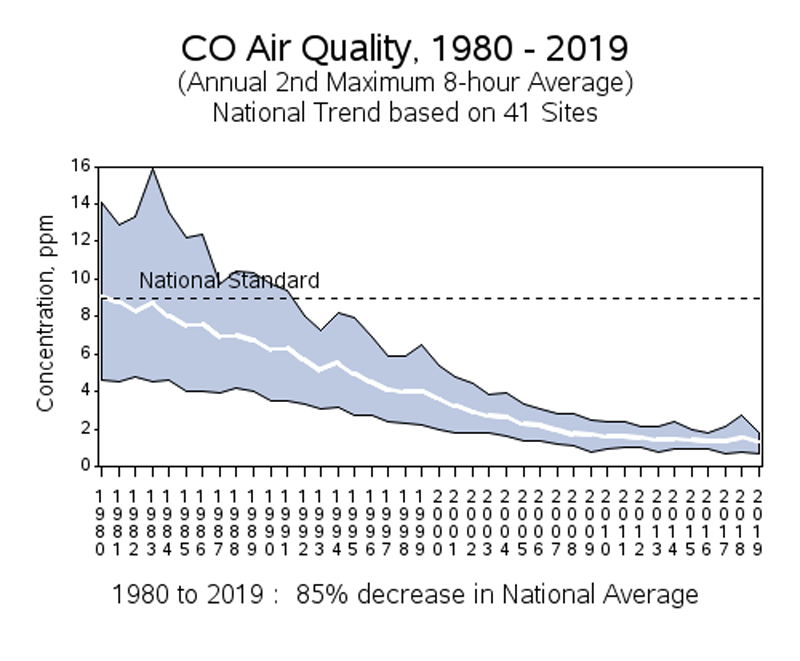
Our post on fossil fuel emissions didn’t show the cumulative effects on air concentration based on those emissions. So, let’s take a deeper look at CO. Levels are trending down in PPM. If you have a specific question, send us a message or plan to join us at the Eastern Gas Compression Roundtable, September 14-16, 2021 at the David Lawrence Convention Center in downtown Pittsburgh, PA.
EGCR: Educating the Oil & Gas Industry Since 1973
CH4 Facts: Fossil Fuel Emissions
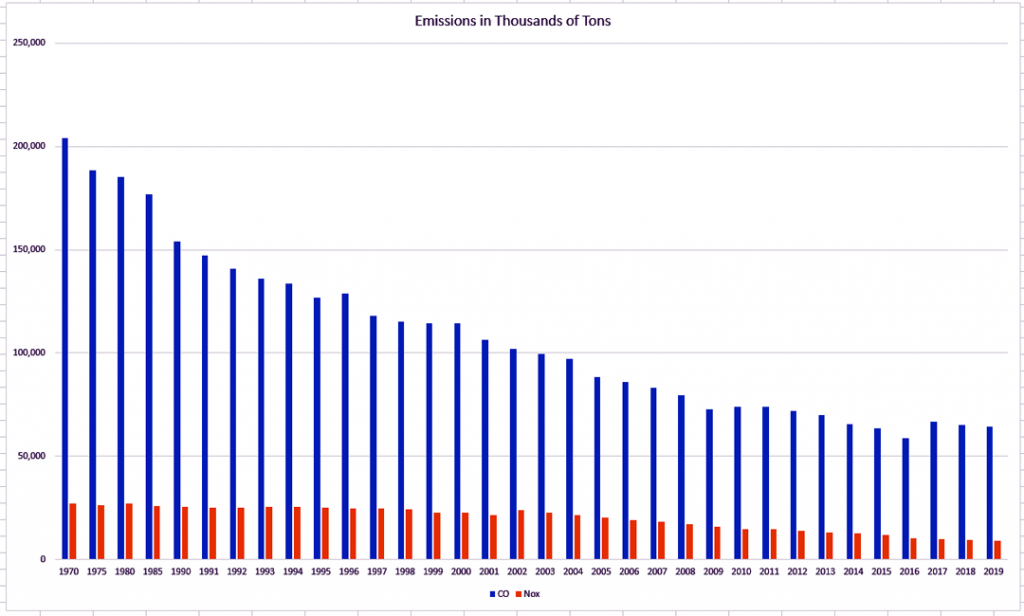
With record natural gas consumption, what about the emissions from all the fossil fuel use? Since our consumption has steadily increased, then surely our emissions have as well right? No. Actually, our emissions controls and technologies have continued to improve, resulting in reductions of emissions. If you have a specific question, send us a message, or plan to join us at the Eastern Gas Compression Roundtable, September 14-16, 2021 at the David Lawrence Convention Center in downtown Pittsburgh, PA.
EGCR: Educating the Oil & Gas Industry Since 1973
CH4 Facts: Electrical Consumption Per Person
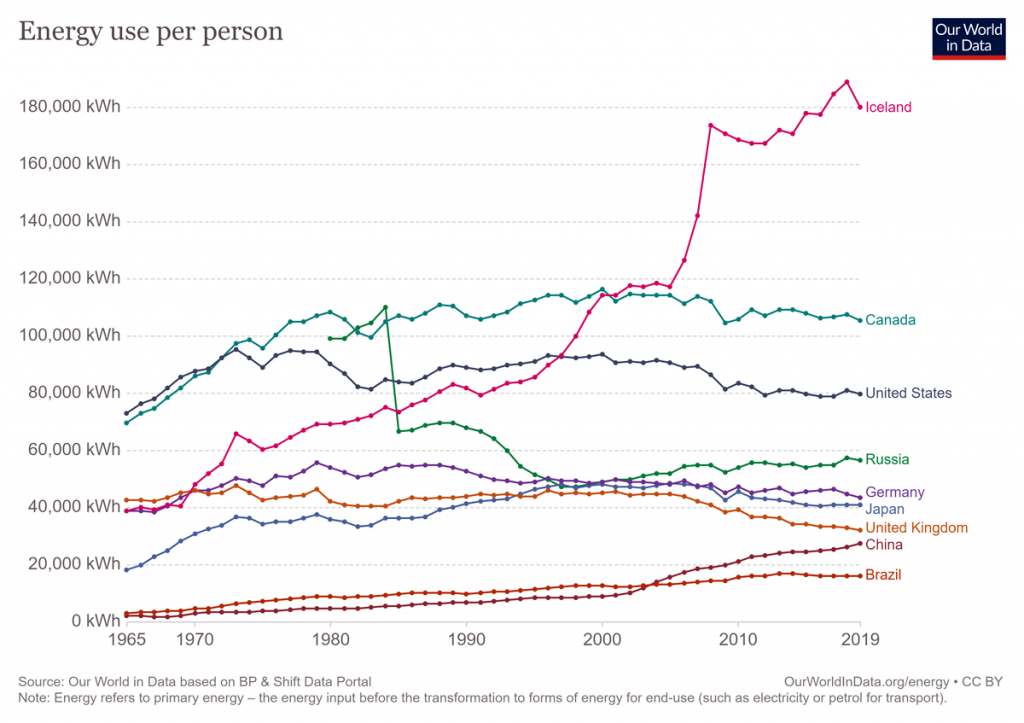
Our last post focused on electrical consumption per nation, but what about per person? Good question… let’s look at the data. Again, notice the fall of the USSR in the late 1980’s in the Russian data. The efficiency improvement trend of developed nations can be seen in this graph, too. If you have a specific question, send us a message or plan to join us at the Eastern Gas Compression Roundtable, September 14-16, 2021 at the David Lawrence Convention Center in downtown Pittsburgh, PA.
EGCR: Educating the Oil & Gas Industry Since 1973
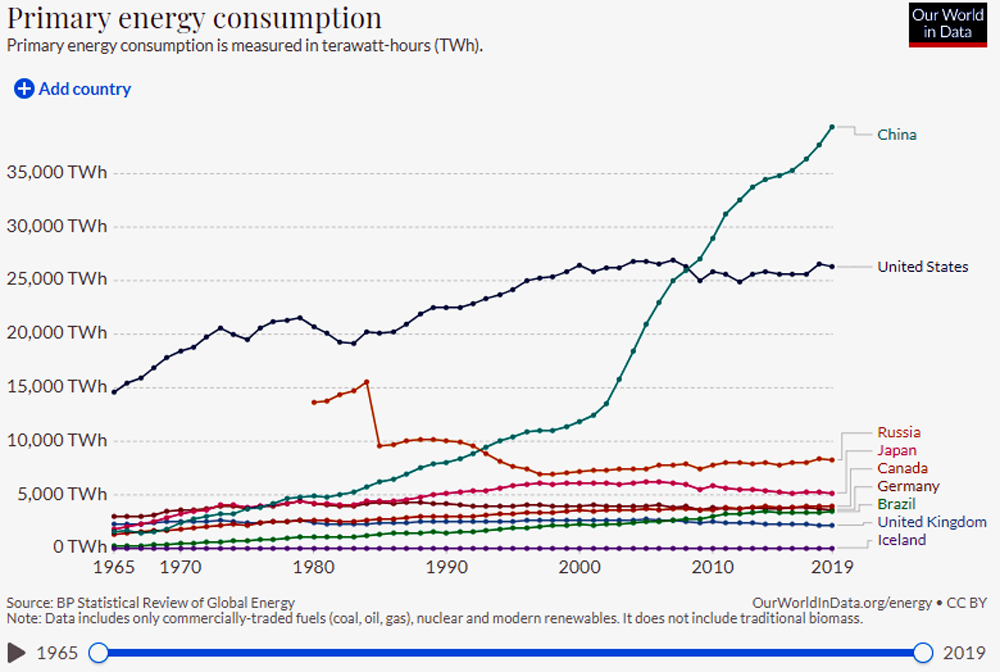
CH4 Facts: Primary Energy Consumption
The US has been breaking records in production, but how do we compare to the rest of the world for consumption per person? Let’s look at the data. It is worth noting that population has steadily increased over this time frame, while you can see a leveling and decline in productions. Similar trends reflecting efficiency improvements can be seen in most developed nations.
Note: Look at the Russian data that shows the fall of the USSR in the late 1980’s. If you have a specific question, send us a message and plan to join us at the Eastern Gas Compression Roundtable, September 14-16, 2021 at the David Lawrence Convention Center in downtown Pittsburgh, PA.
EGCR: Educating the Oil & Gas Industry Since 1973
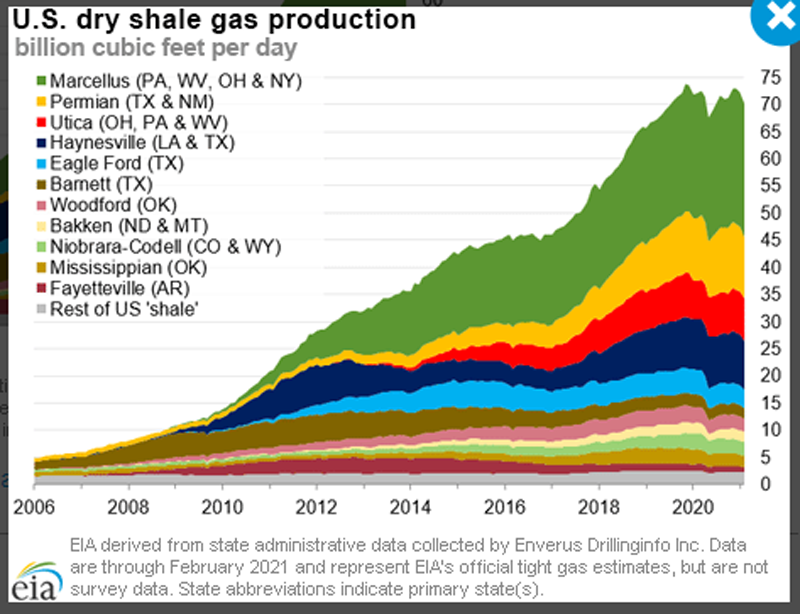
CH4 Facts: Dry Shale Gas Production
In our last post we looked at the shale plays across the US, but how much gas is produced from those areas? In the production by state graphic, we saw that Texas was the biggest producer, but the graphic below shows the details of how. While Pennsylvania falls behind Texas, the Marcellus shale is far outperforming production of the other plays. If you have a specific question, send us a message or plan to join us at the Eastern Gas Compression Roundtable, September 14-16, 2021 at the David Lawrence Convention Center in downtown Pittsburgh, PA.
EGCR: Educating the Oil & Gas Industry Since 1973
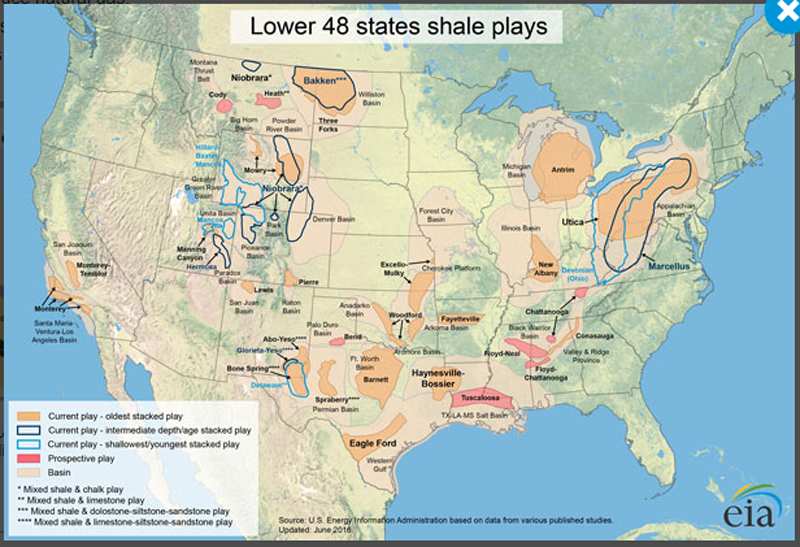
CH4 Facts: Shale
We’ve reviewed state production in previous posts, so let’s take a closer look at geographical areas throughout the US. This graphic shows the shale plays that revolutionized energy in North America and shifted the world energy markets. If you have a specific question, send us a message and then plan to join us at the Eastern Gas Compression Roundtable, September 14-16, 2021 at the David Lawrence Convention Center in downtown Pittsburgh, PA.
EGCR: Educating the Oil & Gas Industry Since 1973
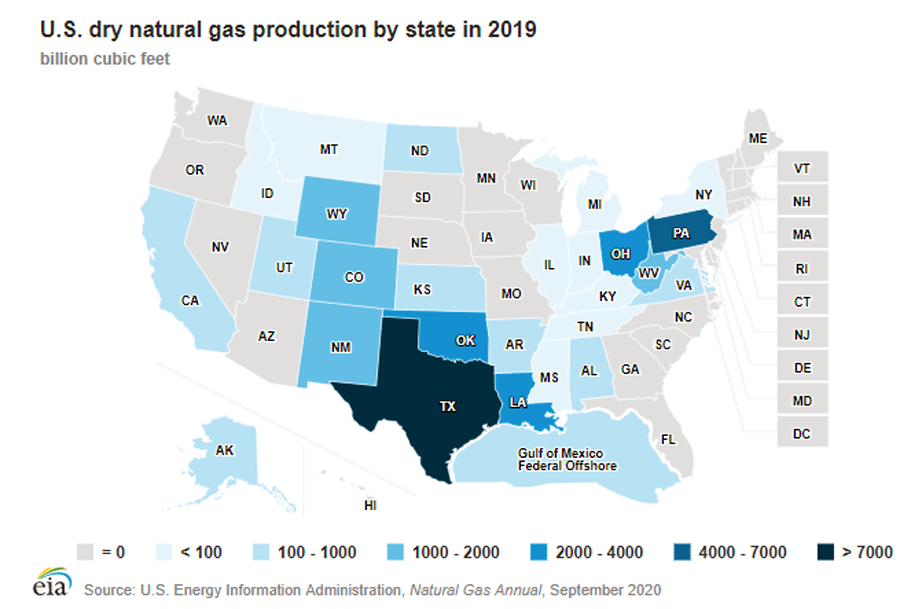
CH4 Facts: US Natural Gas Production by State
Could you explain more about where US natural gas comes from?
Sure… we would be happy to. We’ve already talked about imports, so let’s look at production internally. The graphic below shows production by state. If you have a specific question, send us a message or plan to join us at the Eastern Gas Compression Roundtable, September 14-16, 2021 at the David Lawrence Convention Center in downtown Pittsburgh, PA.
EGCR: Educating the Oil & Gas Industry Since 1973
CH4 Facts: Power Generation Trends
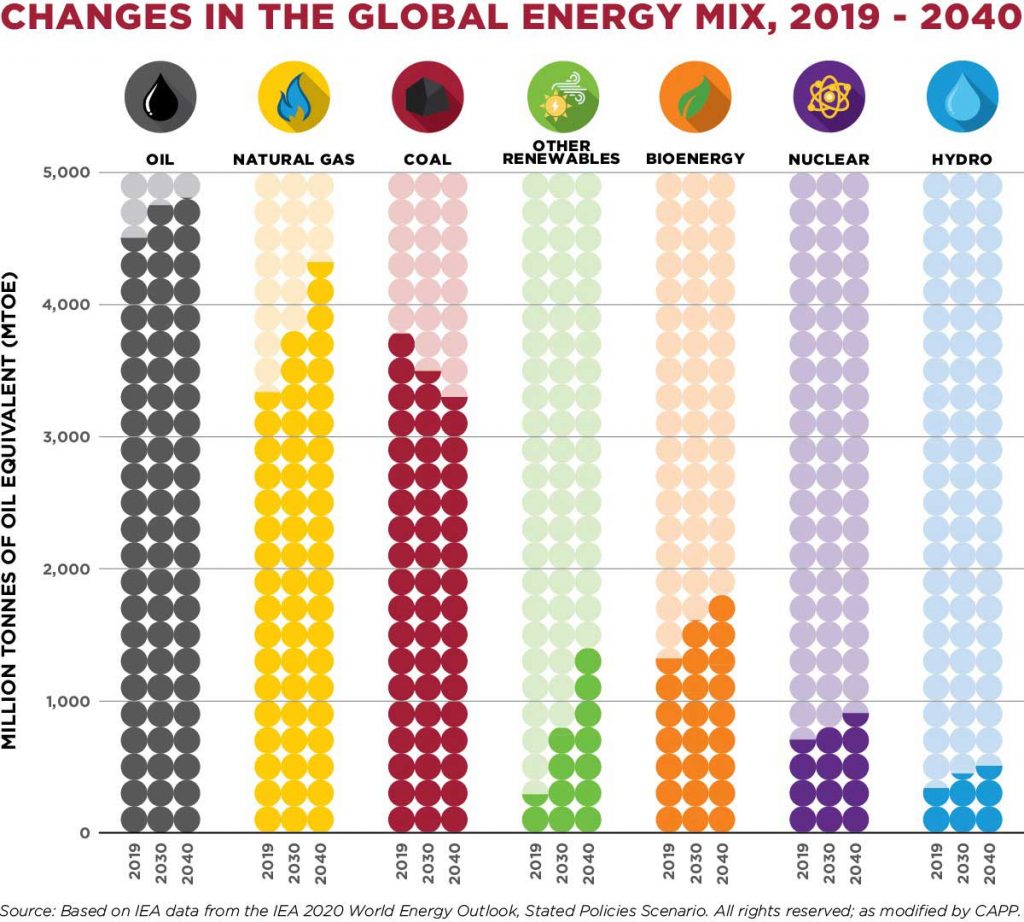
After looking at the historical trends for power generation, are you curious about what the future holds? We are too, so let’s look. Coal consumption is expected to continue to fall with natural gas and renewable growth taking up most of the slack. If you have a specific question, send us a message or plan to join us at the Eastern Gas Compression Roundtable, September 14-16, 2021 at the David Lawrence Convention Center in downtown Pittsburgh, PA.
CH4 Facts: Natural Gas Surpasses Coal
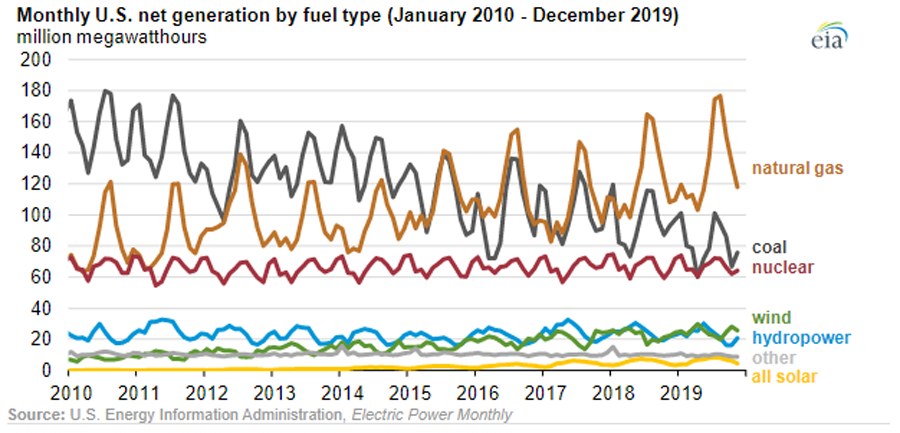
The U.S. has been setting records for Natural Gas consumption repeatedly over the last decade, largely in part to our increased demand from the electricity generators. In fact, Natural Gas surpassed coal in 2016 as the #1 fuel source for power plants and the demand has continued to accelerate as coal power plants have been shuttered. If you have a specific question, send us a message or plan to join us at the Eastern Gas Compression Roundtable, September 14-16, 2021 at the David Lawrence Convention Center in downtown Pittsburgh, PA.