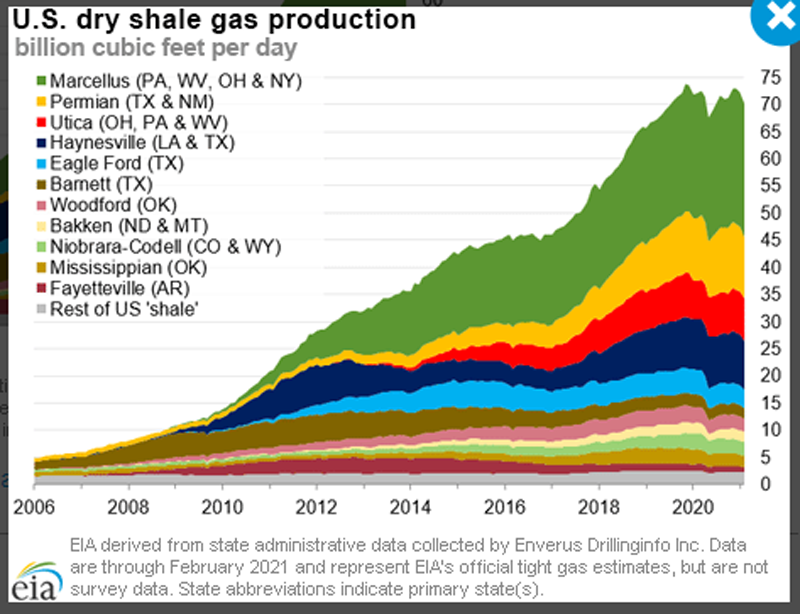
In our last post we looked at the shale plays across the US, but how much gas is produced from those areas? In the production by state graphic, we saw that Texas was the biggest producer, but the graphic below shows the details of how. While Pennsylvania falls behind Texas, the Marcellus shale is far outperforming production of the other plays. If you have a specific question, send us a message or plan to join us at the Eastern Gas Compression Roundtable, September 14-16, 2021 at the David Lawrence Convention Center in downtown Pittsburgh, PA.
CH4 Facts
CH4 Facts: Shale
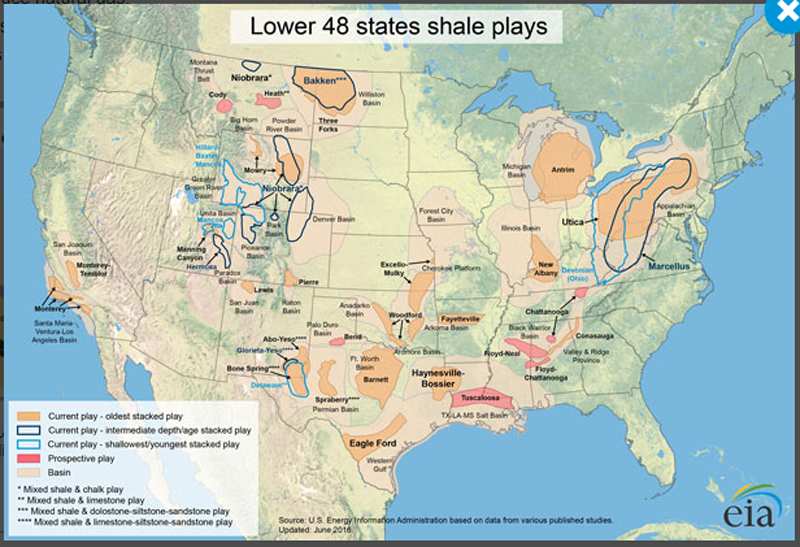
We’ve reviewed state production in previous posts, so let’s take a closer look at geographical areas throughout the US. This graphic shows the shale plays that revolutionized energy in North America and shifted the world energy markets. If you have a specific question, send us a message and then plan to join us at the Eastern Gas Compression Roundtable, September 14-16, 2021 at the David Lawrence Convention Center in downtown Pittsburgh, PA.
EGCR: Educating the Oil & Gas Industry Since 1973
CH4 Facts: US Natural Gas Production by State
Could you explain more about where US natural gas comes from?
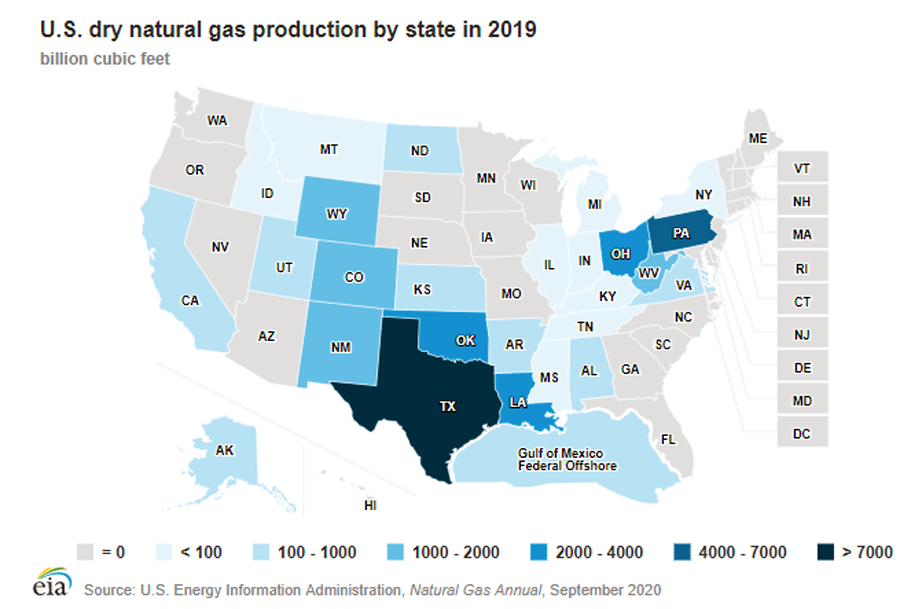
Sure… we would be happy to. We’ve already talked about imports, so let’s look at production internally. The graphic below shows production by state. If you have a specific question, send us a message or plan to join us at the Eastern Gas Compression Roundtable, September 14-16, 2021 at the David Lawrence Convention Center in downtown Pittsburgh, PA.
EGCR: Educating the Oil & Gas Industry Since 1973
CH4 Facts: Power Generation Trends
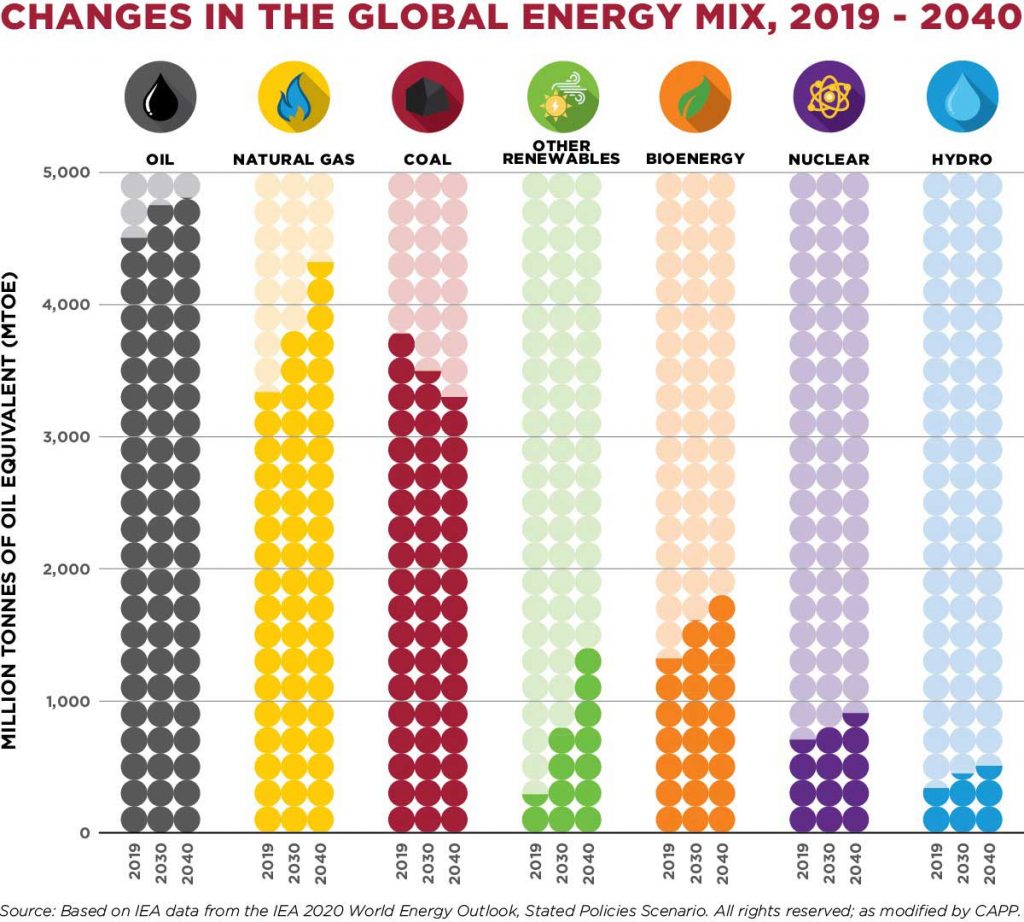
After looking at the historical trends for power generation, are you curious about what the future holds? We are too, so let’s look. Coal consumption is expected to continue to fall with natural gas and renewable growth taking up most of the slack. If you have a specific question, send us a message or plan to join us at the Eastern Gas Compression Roundtable, September 14-16, 2021 at the David Lawrence Convention Center in downtown Pittsburgh, PA.
CH4 Facts: Natural Gas Surpasses Coal
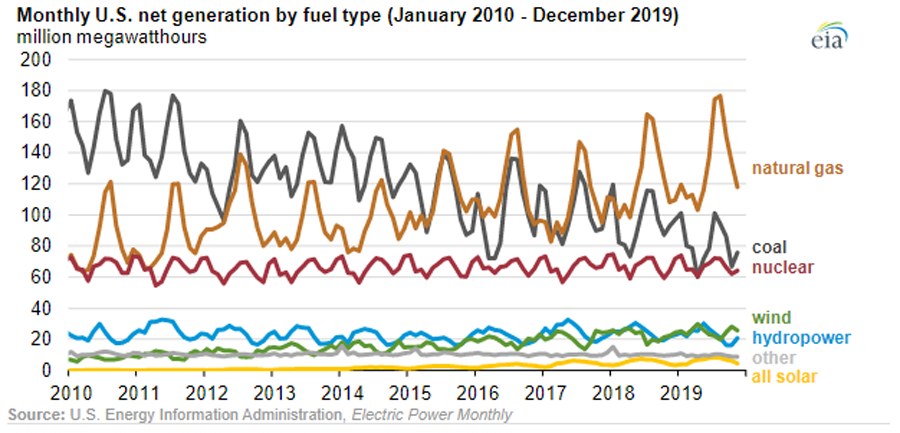
The U.S. has been setting records for Natural Gas consumption repeatedly over the last decade, largely in part to our increased demand from the electricity generators. In fact, Natural Gas surpassed coal in 2016 as the #1 fuel source for power plants and the demand has continued to accelerate as coal power plants have been shuttered. If you have a specific question, send us a message or plan to join us at the Eastern Gas Compression Roundtable, September 14-16, 2021 at the David Lawrence Convention Center in downtown Pittsburgh, PA.
EGCR: Educating the Oil & Gas Industry Since 1973
CH4 Facts: Natural Gas Consumption in the U.S.
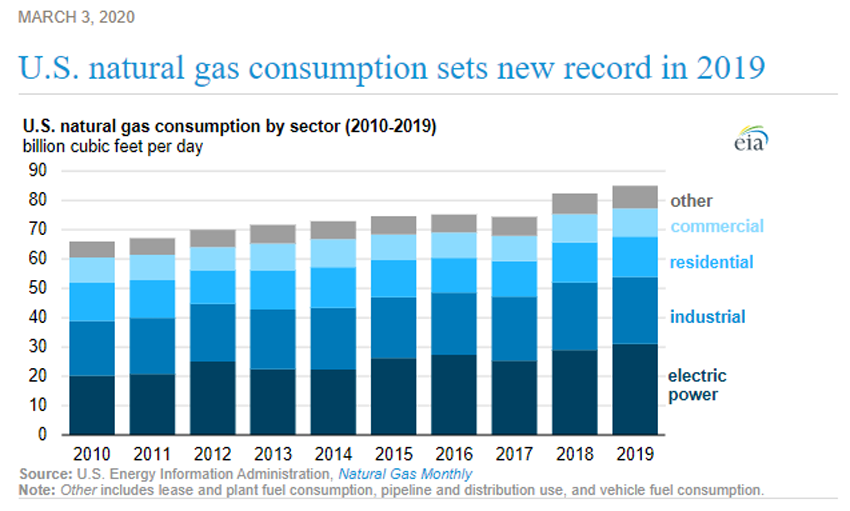
We have looked at imports and exports, but how does the US consume the natural gas the pipelines transport? Let’s look. The US Energy Information Administration publishes those numbers on an annual basis. Anything surprise you in this data? Want to know more? Join us at the Eastern Gas Compression Roundtable, September 14-16, 2021 at the David Lawrence Convention Center in downtown Pittsburgh, PA or contact us for more information.
EGCR: Educating the Oil & Gas Industry Since 1973
CH4 Facts: LNG Imports

Our last post talked about LNG exports and you might be wondering if the US imports more than we export. It’s a great question. We again turned to the “Statistical Review of World Energy” for our research, and here’s what we found. Want to know more? Join us at the Eastern Gas Compression Roundtable, September 14-16, 2021 at the David Lawrence Convention Center in downtown Pittsburgh, PA.
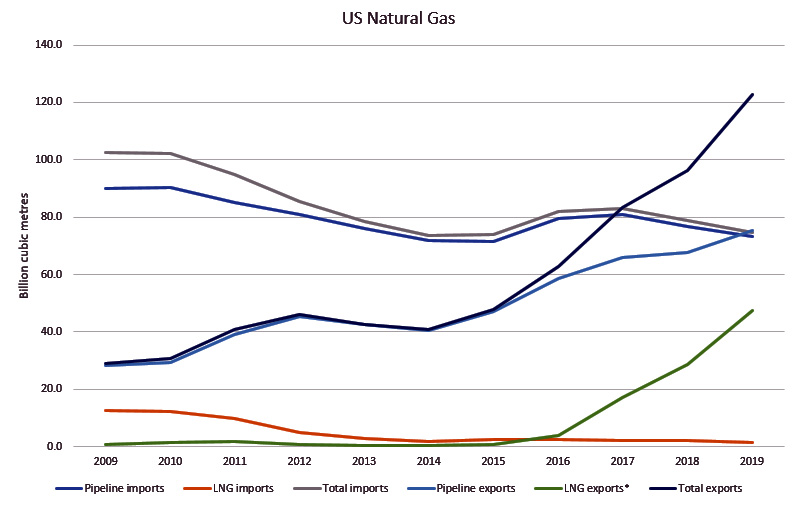
Reference: bp Statistical Review of World Energy 2020 p.40 Natural gas: Inter-regional trade Table
CH4 Facts: LNG Exports

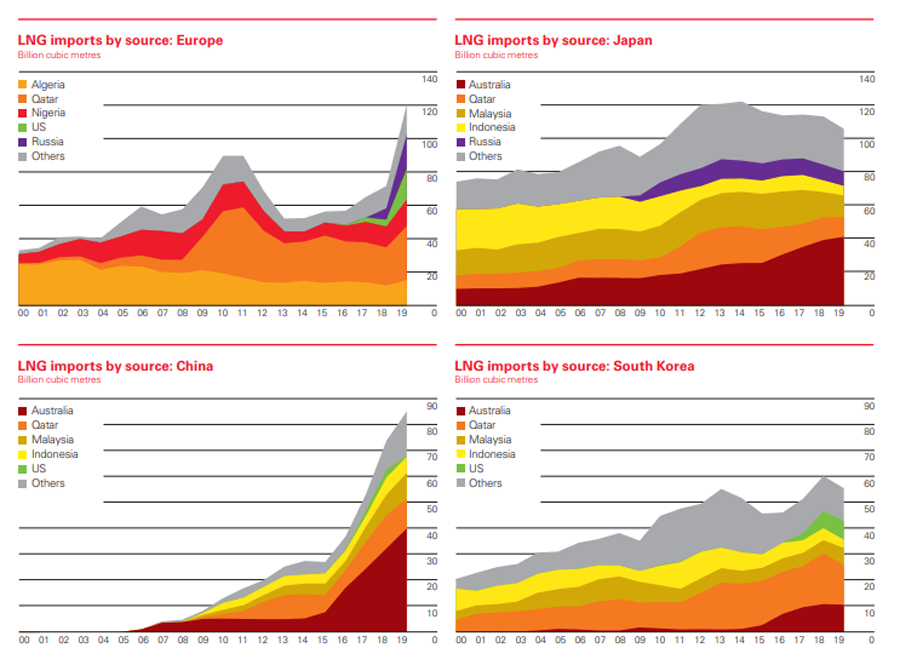
There has been a great deal of talk and infrastructure built around exporting natural gas to other countries… but do you know where? BP publishes an annual report called the “Statistical Review of World Energy.” The graphic below (page 43 of the report) shows major importers to the given areas. Most of the US exports are headed to Europe. Want to know more? Join us at the Eastern Gas Compression Roundtable, September 14-16, 2021 at the David Lawrence Convention Center in downtown Pittsburgh, PA. www.EGCR.org
CH4 Facts: Fossil Fuels
Natural Gas is composed of 1 carbon element and 4 Hydrogen elements, and the chemical equation is CH4. The gas is shipped from producers to consumers through a myriad of pipelines spread across the US. In this series of posts, we hope to relay information about the natural gas industry regionally and globally. We are often presented with data relaying the potential hazards of fossil fuel use, but those publications never view the facts through a balanced lens that compares advantages to hazards. We are going to present you with some data supporting the use of fossil fuels. If you have a specific question, send us a message or drop a comment, then plan to join us at the Eastern Gas Compression Roundtable, September 14-16, 2021 at the David Lawrence Convention Center in downtown Pittsburgh, PA. www.EGCR.org
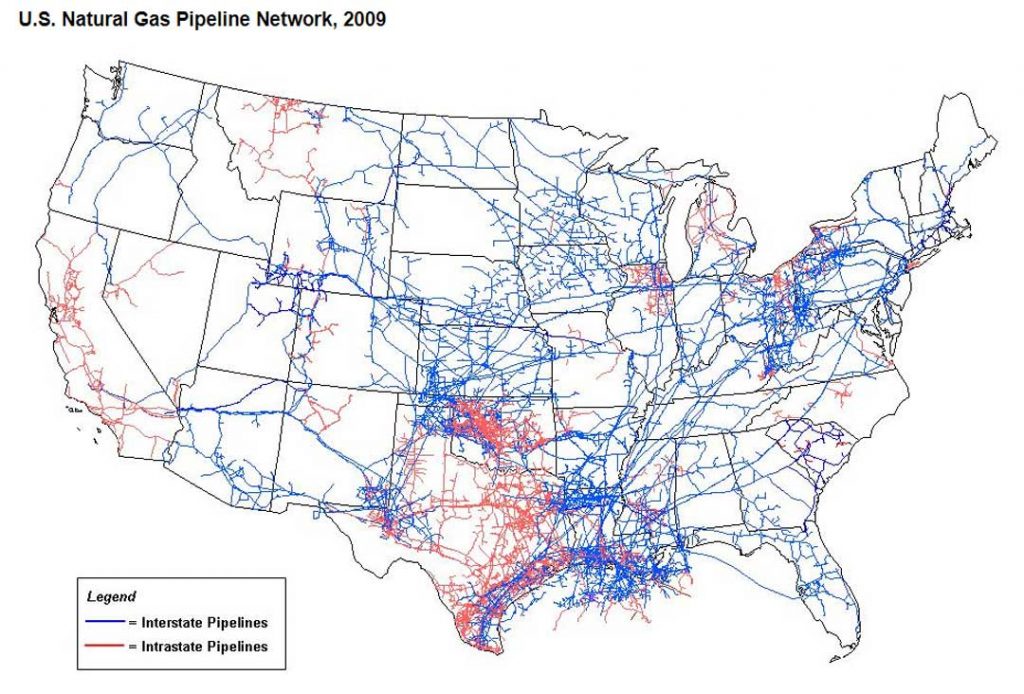
Source: US Energy Information Administration. EIA – Natural Gas Pipeline Network – U.S. Natural Gas Pipeline Network Map
